

SaaS Retention Metrics Explained for Growth Leaders
TL;DR:
- Retention metrics like GRR and NRR reveal how well SaaS companies retain revenue and measure growth potential. Segmenting data by customer type and channel provides clear insights, guiding targeted interventions to reduce churn and boost revenue. Applying these metrics consistently helps build a durable, growth-driven SaaS business.
SaaS retention metrics are the quantitative signals that reveal how well a software company holds onto its customers and recurring revenue. Gross Revenue Retention (GRR), Net Revenue Retention (NRR), and logo churn are the three pillars of any serious retention measurement framework. A 5% increase in retention can lift profits by 25–95%, which means retention is not a support function. It is a revenue strategy. SaaS business leaders who treat these numbers as lagging indicators miss the window to intervene before customers go silent. This article breaks down every metric worth tracking, explains what healthy benchmarks look like in 2026, and shows how to apply the data to reduce churn and grow revenue from your existing customer base.
What are the key SaaS retention metrics worth tracking?
SaaS retention metrics fall into two categories: customer-count metrics and revenue metrics. Both are necessary. Tracking only one gives you a distorted picture of your business health.

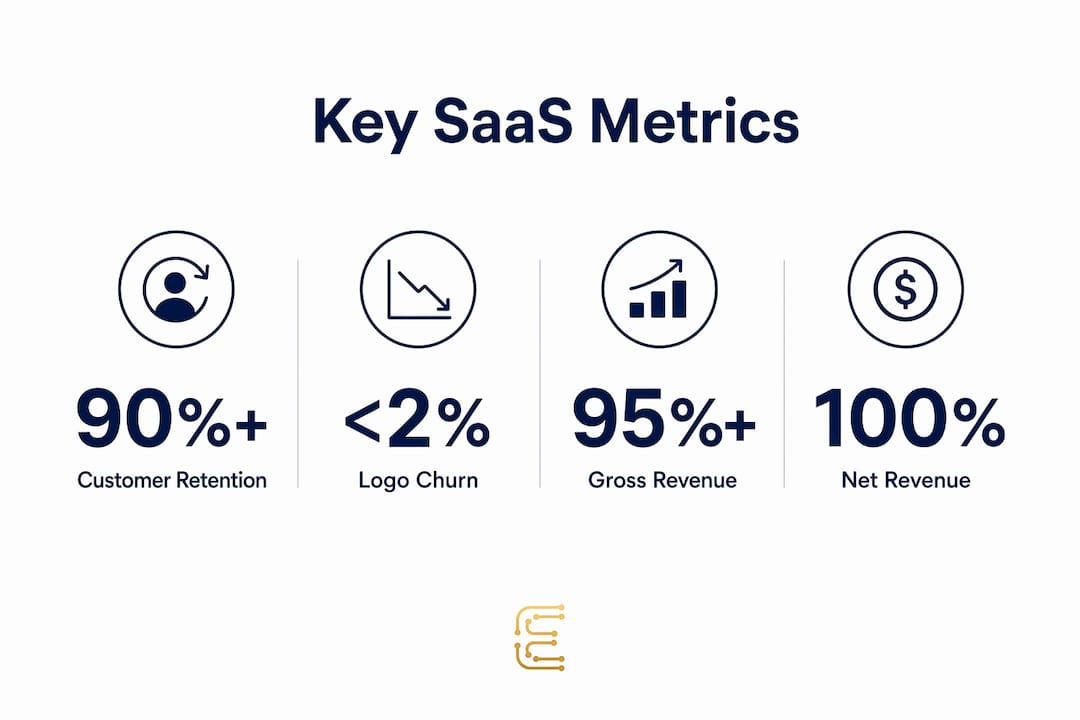
Customer Retention Rate (CRR) measures the percentage of customers you keep over a given period, excluding new customers acquired during that time. It is the inverse of logo churn. If you start a quarter with 200 customers and end with 185 (with no new additions counted), your CRR is 92.5%.
Logo churn counts the raw number of customers who cancel. Healthy logo churn sits below 2% monthly for SMB products and below 0.5% monthly for enterprise SaaS. Those numbers sound small, but at 2% monthly churn, you lose roughly 22% of your customer base every year.
Gross Revenue Retention (GRR) measures the percentage of recurring revenue retained from existing customers, excluding any expansion. It captures only contraction and cancellation. GRR can never exceed 100%, which makes it a clean signal for revenue leakage. Best-in-class GRR targets 90%+ for SMB, 95%+ for mid-market, and 98%+ for enterprise. Any GRR below 85% signals a structural churn problem that expansion revenue cannot mask.
Net Revenue Retention (NRR) adds expansion revenue (upsells, cross-sells, seat additions) back into the GRR calculation. Top SaaS performers target NRR above 120% for enterprise and around 100% for SMB. An NRR above 100% means your existing customers are growing your revenue even before you acquire a single new account.
Cohort retention curves plot the percentage of a customer group still active at each month after acquisition. Cohort curves that flatten above 80% by month 12 indicate strong long-term retention. A curve that keeps declining through month 12 signals a product or fit problem that no amount of customer success outreach will solve alone.
Expansion MRR tracks revenue added from existing customers through upgrades and add-ons. Targeting expansion MRR at 10% or more of starting MRR annually is a healthy benchmark. This metric separates companies that grow through acquisition only from those that build compounding revenue engines inside their existing base.
| Metric | Definition | Formula | Healthy Benchmark |
|---|---|---|---|
| Customer Retention Rate | % of customers retained | (End customers / Start customers) × 100 | >90% annually |
| Logo Churn | % of customers lost | Churned / Start customers × 100 | <2% monthly (SMB) |
| Gross Revenue Retention | % of recurring revenue kept | (MRR retained / Starting MRR) × 100 | 90–98%+ by segment |
| Net Revenue Retention | Revenue retained plus expansion | (Retained + Expansion MRR / Starting MRR) × 100 | 100–120%+ |
| Expansion MRR | Revenue from upsells and upgrades | New expansion revenue / Starting MRR | ≥10% annually |
| Cohort Retention | % of cohort still active at month N | Active cohort members / Original cohort | >80% at month 12 |
How do SaaS retention benchmarks vary by market segment?
Retention benchmarks are not universal. Applying enterprise targets to an SMB product, or vice versa, produces misleading conclusions and misdirected strategy.
GRR targets differ sharply by segment: SMB products should aim for 90%+, mid-market for 95%+, and enterprise for 98%+. The gap exists because enterprise contracts are larger, stickier, and involve deeper product integration. SMB customers churn faster by nature, often due to budget cuts or business closures that have nothing to do with product quality.
Logo churn benchmarks follow the same pattern: under 2% monthly for SMB and under 0.5% monthly for enterprise. A 1% monthly logo churn rate looks fine for an enterprise SaaS company but signals a serious problem for a product-led growth tool targeting small teams.
Segmentation by acquisition channel and plan type adds another layer of precision. Customers acquired through paid search often churn faster than those acquired through referral or content. Customers on annual plans churn at lower rates than monthly subscribers. Retention cohort analysis segmented by ICP, plan, and channel reveals whether churn is a product problem or a sales fit problem. Without that segmentation, you cannot tell the difference.
Pro Tip: Build a separate retention dashboard for each customer segment. Blending SMB and enterprise data into a single retention number hides the real story and leads to the wrong interventions.
| Segment | GRR Target | Monthly Logo Churn | NRR Target |
|---|---|---|---|
| SMB | 90%+ | <2% | ~100% |
| Mid-market | 95%+ | <1% | 105–115% |
| Enterprise | 98%+ | <0.5% | >120% |
What do retention metrics reveal about customer behavior and growth potential?
Retention metrics are not just scorecards. They are diagnostic tools that reveal where customers disengage, where revenue compounds, and where the leaky bucket drains fastest.
Activation rate is the most underused early retention signal. Activation milestones within the first 7 days are critical: below 30% activation at day 7 predicts poor retention regardless of what happens downstream. This means that a customer who does not reach your product’s core value moment in the first week is statistically unlikely to renew. No amount of check-in emails or QBRs will compensate for a broken onboarding experience.
Expansion MRR as a retention signal tells you which customers are growing with your product. Customers who upgrade are not just paying more. They are signaling deep product adoption and low churn risk. Tracking expansion MRR by cohort and segment shows you which customer profiles have the highest growth ceiling.
Involuntary churn is the silent killer that most retention dashboards ignore. Involuntary churn accounts for 20–40% of all SaaS churn. These are customers who wanted to stay but lost access due to failed payments. Recovering these customers costs nothing in acquisition spend and requires only a disciplined payment recovery process.
WAU/MAU ratio (weekly active users divided by monthly active users) measures engagement intensity. A WAU/MAU ratio above 0.5 indicates that users return to the product multiple times per week. Products with high WAU/MAU ratios consistently show stronger retention cohort curves. This metric connects product usage behavior to revenue retention in a way that pure financial metrics cannot.
Pro Tip: Track the Churn Health Score alongside your financial retention metrics. A Churn Health Score on a 0–100 scale measures the severity of churn drivers in real time, giving your customer success team a forward-looking signal rather than a rearview mirror.
How can SaaS businesses apply retention metrics to reduce churn?
Measuring retention metrics is the first step. Applying them to change customer outcomes is where growth actually happens.
Start with cohort-based tracking. Aggregate retention rates hide the causes of churn. Cohort analysis segmented by ICP, acquisition channel, and plan type shows you exactly which customer groups are healthy and which are at risk. Retention starts before contract signature by targeting the right ICP. Customers who were never a good fit will churn early, and no downstream retention strategy can fix a sales fit problem.
Fix activation before anything else. If your 7-day activation rate is below 30%, your retention metrics will not improve no matter how much you invest in customer success headcount. Map your activation milestones, identify where customers drop off, and redesign the onboarding experience to deliver your core value moment faster. Personalization at the onboarding stage, such as role-based setup flows or industry-specific templates, consistently improves activation rates.
Build a payment recovery process. Optimizing dunning and retry logic can recover 30–70% of failed payments at zero acquisition cost. This is the highest-ROI retention intervention most SaaS companies ignore. A structured dunning sequence with smart retry timing, in-app notifications, and email escalation recovers revenue that would otherwise count as involuntary churn.
Track expansion MRR as a growth lever. Identify the customer behaviors that correlate with upgrades, such as feature adoption milestones, seat additions, or usage thresholds. Build automated triggers that prompt upsell conversations at the right moment. Customers who expand are your best retention asset and your most efficient revenue channel.
Set realistic targets and iterate. Retention improvement is not a one-quarter project. Set 90-day targets for each metric by segment, measure the impact of each intervention, and adjust. The companies that win on retention treat it as a continuous feedback loop, not a one-time fix.
Pro Tip: Avoid the common mistake of optimizing NRR while ignoring GRR. A high NRR built on heavy expansion from a shrinking customer base is a fragile growth model. Healthy retention requires both metrics moving in the right direction simultaneously.
Key Takeaways
Retention metrics are the most direct measure of SaaS business health, and GRR, NRR, logo churn, and activation rate together form the complete picture of where revenue is won or lost.
| Point | Details |
|---|---|
| GRR is your baseline signal | GRR below 85% indicates structural churn that expansion revenue cannot hide. |
| Segment your benchmarks | SMB, mid-market, and enterprise each require different retention targets to diagnose performance accurately. |
| Activation predicts retention | Below 30% activation at day 7 predicts poor long-term retention regardless of downstream efforts. |
| Involuntary churn is recoverable | Payment recovery processes can recoup 30–70% of failed-payment churn at zero acquisition cost. |
| NRR above 100% signals compounding growth | An NRR above 100% means existing customers grow your revenue before you acquire anyone new. |
The metric most SaaS leaders are still getting wrong
After working with SaaS founders across growth stages, the pattern I see most often is not a lack of data. It is a misreading of which data matters first. Teams obsess over NRR because it looks impressive in board decks, while their GRR quietly erodes below 85%. That combination is a slow leak in a pressurized system.
The other blind spot is treating retention metrics as a customer success problem rather than a company-wide signal. When activation rates are low, that is a product problem. When logo churn spikes in a specific acquisition channel, that is a sales and marketing problem. Retention metrics tell you where the breakdown is, but only if you have segmented the data well enough to hear what it is saying.
The leaders who build durable SaaS businesses use retention metrics as a shared language across product, sales, and customer success. They review SaaS retention insights regularly, not just at the end of a quarter. They set targets by segment, not by company average. And they treat a 5% improvement in retention not as a small win but as a compounding asset that reshapes their revenue trajectory over 24 months.
The metrics are not complicated. The discipline to act on them consistently is where most teams fall short.
— Raymond
How E-regency helps SaaS leaders act on retention data
SaaS founders who understand their retention metrics but struggle to translate that data into a clear plan often face the same gap: the distance between knowing the number and knowing the intervention.
E-regency works directly with SaaS founders and customer success leaders to interpret retention metrics, identify the highest-impact interventions, and build the frameworks to execute them. Clients have seen over a 20% reduction in gross churn and more than a 115% increase in net revenue retention through E-regency’s AI-driven health modeling and hands-on advisory approach. If your GRR is slipping or your activation rates are not where they need to be, the right starting point is a direct conversation. Schedule an advisory session with E-regency to build a retention strategy grounded in your actual data.
FAQ
What is a good SaaS retention rate?
A healthy annual customer retention rate is above 90% for SMB SaaS and above 95% for enterprise products. GRR below 85% signals a serious churn problem regardless of expansion revenue.
What is the difference between GRR and NRR?
GRR measures recurring revenue retained from existing customers excluding expansion, while NRR adds upsell and expansion revenue. GRR cannot exceed 100%; NRR can and should exceed 100% for high-growth SaaS.
How does activation rate affect long-term retention?
Activation milestones within the first 7 days are the strongest early predictor of retention. Below 30% activation at day 7 means downstream retention efforts are unlikely to succeed.
What causes involuntary churn and how do you fix it?
Involuntary churn results from failed payments and accounts for 20–40% of all SaaS churn. A structured dunning process with smart retry logic can recover 30–70% of that lost revenue.
Why should retention metrics be segmented by customer type?
Blending SMB and enterprise data into a single retention number hides the real causes of churn. Segmenting by ICP, plan type, and acquisition channel reveals whether churn is a product failure or a sales fit problem.