

What Is Revenue Churn? A 2026 Guide for SaaS Founders
TL;DR:
- Revenue churn measures the dollar value of revenue lost from customer cancellations and downgrades. Tracking both gross and net revenue churn helps SaaS companies identify retention issues and growth opportunities. Achieving negative net revenue churn indicates that existing customer expansion drives organic revenue growth.
Revenue churn is the percentage of monthly recurring revenue (MRR) lost from existing customers through cancellations and downgrades in a given period. Unlike customer churn, which counts lost accounts, revenue churn measures the actual dollar impact of attrition. A SaaS company can lose five small accounts and barely feel it financially, yet lose one enterprise client and watch its MRR collapse. For founders and executives making forecasting, hiring, and acquisition decisions, revenue churn is the metric that tells the truth about business health.
What is revenue churn and how is it calculated?
Revenue churn has two standard forms: gross revenue churn and net revenue churn (NRR). Each answers a different question, and confusing them leads to bad decisions.

Gross revenue churn
Gross revenue churn is calculated as:
(MRR lost to cancellations + MRR lost to downgrades) ÷ MRR at start of period × 100
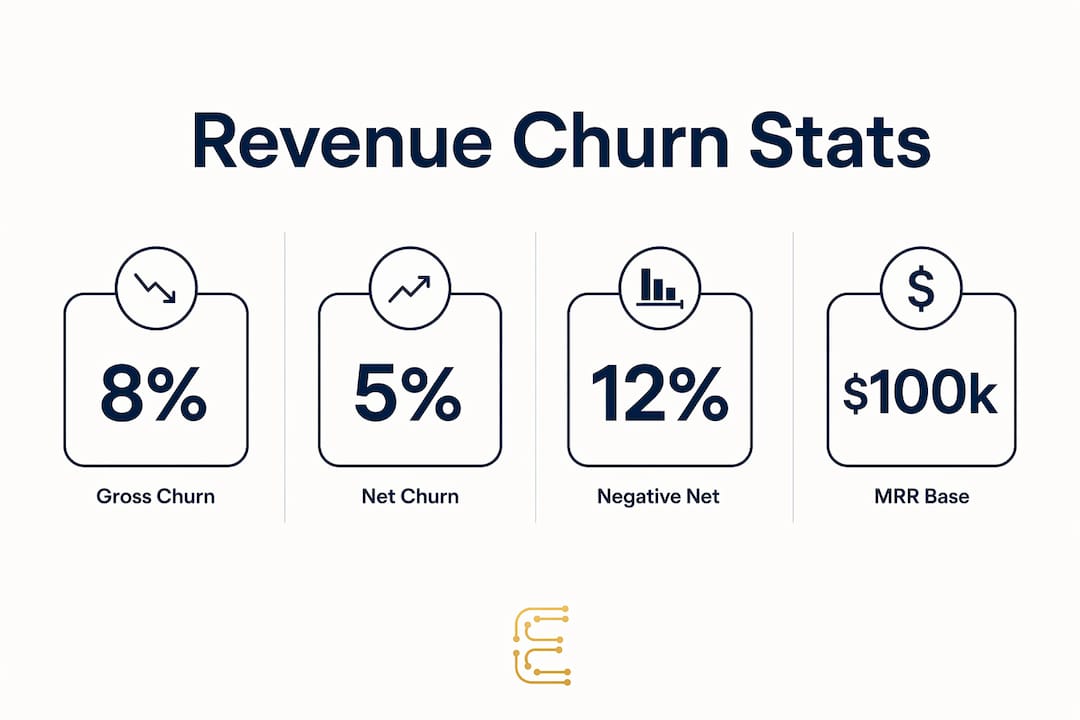
A company with $100,000 in MRR that loses $8,000 from cancellations and downgrades carries an 8% gross revenue churn rate. That number tells you exactly how much of your existing revenue base is eroding each month, before any new business enters the picture.
Net revenue churn
Net revenue churn adjusts for expansion revenue from upsells and cross-sells:
(MRR lost to churn and downgrades − MRR gained from expansions) ÷ MRR at start × 100
Using the same $100,000 MRR base: if you lose $10,000 but gain $5,000 in expansion revenue from existing customers, your net revenue churn is 5%. The gross rate is 10%, but the net rate is 5%. That gap reveals how much your expansion motion is compensating for losses.
Pro Tip: Track both gross and net revenue churn simultaneously. Gross churn shows your retention problem. Net churn shows whether your upsell motion is masking it or genuinely solving it.
Negative net revenue churn: the growth signal
Negative net revenue churn occurs when expansion revenue exceeds lost revenue entirely. If that same company gains $12,000 in expansions against $10,000 in losses, net revenue churn is negative 2%. That means the existing customer base is growing on its own, without a single new logo. Negative net revenue churn is the clearest signal that a SaaS product delivers enough value for customers to spend more overtime.
Why revenue churn matters more than customer churn
Customer churn, often called logo churn, counts the number of accounts lost. Revenue churn measures the financial consequence of those losses. The two metrics can tell completely opposite stories about the same business.
Consider this scenario: a SaaS company loses 2.5% of its customers in a quarter. That sounds manageable. But if those departing customers were enterprise accounts, 2.5% logo churn can correspond to 9% revenue churn. A CFO modeling next year’s ARR using logo churn data would dramatically overestimate the revenue base available to fund growth.
Relying only on customer churn can dangerously mislead SaaS executives, especially in enterprise markets. A low logo churn rate may hide a much higher revenue churn from lost high-value accounts. The financial risk is invisible until it shows up in a missed revenue target.
The core problem is that customer number stability can mask revenue losses from high-value client attrition. Losing one $500-per-month customer on a $1,000 MRR base is a 50% revenue loss. Losing five $10-per-month customers on the same base is only a 5% revenue loss, despite the higher account count. Revenue churn captures that asymmetry. Customer churn does not.
The CFO’s forecasting problem
CFOs model future revenue by starting with existing ARR and subtracting expected revenue churn. That subtraction directly sets the Customer Acquisition Cost (CAC) budget. A 10% revenue churn rate means the company must replace 10% of its ARR annually just to hold flat. Every dollar spent replacing lost revenue is a dollar not spent on growth. Revenue churn, not logo churn, is the number that determines how hard the sales team has to run just to stay in place.
Strategies to reduce revenue churn in SaaS
Reducing revenue churn requires a different approach than reducing customer churn. The financial stakes are concentrated in a small number of accounts, so the tactics must match that concentration.
Focus account management on high-value customers. Losing a $50,000 account impacts revenue more than losing ten $500 accounts. Dedicated Customer Success Managers (CSMs) assigned to top-tier accounts reduce the risk of silent churn, where dissatisfaction builds undetected until the cancellation notice arrives.
Monitor usage and engagement continuously. Customer telemetry, meaning product usage data, login frequency, and feature adoption rates, provides early warning signals before a customer decides to leave. A drop in weekly active usage three months before renewal is a churn signal, not a coincidence. Teams that act on that signal with outreach, training, or executive engagement prevent the loss. Teams that wait for the renewal conversation often lose it.
Build executive-level relationships before renewal season. Executive relationship building with key accounts enables early identification of renewal risks and budget changes. When your primary contact leaves a client company, an executive relationship at the VP or C-suite level keeps the account stable through the transition. Quarterly Business Reviews (QBRs) are the standard mechanism for maintaining those relationships and demonstrating ongoing value.
Drive expansion revenue to achieve negative net revenue churn. Upsells, cross-sells, and seat expansions within existing accounts do two things simultaneously: they increase MRR and they reduce net revenue churn. A customer who upgrades their plan is not a churn risk. Building a structured expansion motion, tied to usage milestones and business outcomes, turns your existing customer base into a growth engine.
Pro Tip: Segment your customer base by revenue contribution before building your retention program. The top 20% of accounts by MRR likely represent the majority of your revenue churn risk. Start there.
Aggressive expansion strategies can mask a high gross revenue churn rate, but they do not fix the underlying retention problem. Sustainable SaaS growth requires reducing gross churn structurally first, then layering expansion revenue on top of a stable base.
How to monitor revenue churn in SaaS dashboards
Effective revenue churn monitoring requires tracking the right metrics at the right frequency. A dashboard that shows only total MRR misses the internal dynamics driving growth or decline.
Effective SaaS dashboards track gross revenue churn, net revenue churn, and expansion revenue as distinct line items. Combining them into a single “net MRR change” number hides the leaky bucket problem. A company adding $20,000 in new MRR while losing $18,000 to churn looks healthy on a net basis. It is not. The churn rate is unsustainable, and the new business motion is papering over a structural retention failure.
Key metrics to include in every revenue churn report
The minimum viable revenue churn dashboard for a SaaS executive team includes four data points: gross MRR churn rate, net MRR churn rate, expansion MRR, and churn by customer segment. Segment-level churn data separates enterprise account losses from SMB losses, which require entirely different responses. Enterprise churn triggers an executive escalation. SMB churn triggers a product or onboarding review.
Reporting frequency matters as much as the metrics themselves. Monthly reporting catches trends early enough to act. Quarterly-only reporting often surfaces problems after the renewal window has already closed. The finance, product, and customer success teams should review the same revenue churn dashboard, not separate versions of it. Misaligned data creates misaligned priorities, and misaligned priorities accelerate churn.
For deeper context on building a retention-focused reporting culture, the E-regency blog covers the operational frameworks SaaS teams use to connect churn data to daily decision-making.
Key Takeaways
Revenue churn is the definitive financial health metric for SaaS businesses, and reducing it structurally, before relying on expansion revenue, is the only path to sustainable growth.
| Point | Details |
|---|---|
| Revenue churn definition | Revenue churn measures MRR lost to cancellations and downgrades, not just the number of accounts lost. |
| Gross vs. net churn | Gross churn shows raw retention loss; net churn adjusts for expansion revenue from existing customers. |
| Logo churn misleads | A 2.5% customer churn rate can correspond to 9% revenue churn when enterprise accounts are leaving. |
| Negative churn is the goal | Negative net revenue churn means existing customers grow your MRR without any new logo acquisition. |
| Dashboard transparency | Finance, product, and customer success teams must share the same revenue churn data to act in time. |
Revenue churn is the metric most SaaS boards are still underreading
I have worked with SaaS founders across growth stages, and the pattern is consistent: the board deck shows customer count, logo retention, and new ARR. Revenue churn appears as a footnote, if it appears at all. That ordering reflects a fundamental misunderstanding of where financial risk actually lives.
The companies I have seen struggle most with revenue predictability are not the ones with high customer churn. They are the ones with stable customer counts and quietly deteriorating revenue churn. A handful of large accounts leave, the logo number barely moves, and suddenly the ARR model is $2 million short of plan. The CFO scrambles to explain it. The sales team is blamed for not closing enough new business. The real problem, a retention failure in the top account tier, goes unaddressed.
The cultural shift required is straightforward but uncomfortable. Revenue churn has to become a first-class metric in every executive conversation, not a secondary calculation derived from the customer count. That means CSMs are measured on revenue retained, not just accounts retained. It means product roadmaps are prioritized by the revenue at risk from dissatisfied enterprise customers, not by feature request volume. It means the finance team models ARR starting from churn, not from growth.
The companies that achieve negative net revenue churn do not get there by accident. They build the operational discipline to monitor, report, and act on revenue churn data before the renewal conversation starts. That discipline is available to any SaaS team willing to prioritize it.
— Raymond
How E-regency helps SaaS founders reduce revenue churn
SaaS founders who understand revenue churn still need the operational infrastructure to act on it. Knowing the formula is not the same as having a retention program that works.
E-regency works directly with SaaS founders and executives to build data-driven retention strategy frameworks that address gross churn at its source. Clients have achieved over a 20% reduction in gross churn and more than 115% increase in net revenue retention through E-regency’s predictive health modeling and hands-on execution approach. If your revenue churn rate is rising or your expansion motion is masking a deeper retention problem, a personalized advisory session with E-regency gives you a clear diagnosis and a prioritized plan to fix it.
FAQ
What is the revenue churn definition in SaaS?
Revenue churn is the percentage of MRR lost from existing customers through cancellations and downgrades in a given period. It measures financial loss, not account count.
What is the revenue churn formula?
Gross revenue churn equals MRR lost to cancellations and downgrades divided by MRR at the start of the period, multiplied by 100. Net revenue churn subtracts expansion MRR from losses before dividing.
How does revenue churn differ from customer churn?
Customer churn counts lost accounts; revenue churn measures the dollar value of those losses. A 2.5% logo churn rate can correspond to 9% revenue churn when high-value enterprise accounts are the ones leaving.
What is negative net revenue churn?
Negative net revenue churn occurs when expansion revenue from existing customers exceeds MRR lost to cancellations and downgrades. It is the clearest indicator that a SaaS product drives organic revenue growth from its existing base.
How often should SaaS teams review revenue churn data?
Monthly review is the minimum effective frequency. Finance, product, and customer success teams should review the same dashboard to align retention priorities before renewal windows close.