

What Is Customer Journey Analytics? A Guide for CX Teams
TL;DR:
- Customer journey analytics sequences all customer interactions across channels into a unified timeline. It transforms fragmented data into actionable insights that improve proactive retention strategies.
Customer journey analytics is the quantitative process of measuring and analyzing every customer interaction across digital and physical touchpoints to build a unified, data-driven picture of the end-to-end experience. Unlike traditional web analytics, which reports on isolated sessions or single-channel events, journey analytics stitches together cross-channel interactions including email, mobile app, website visits, in-store activity, and call center data into one continuous customer timeline. For marketing professionals and customer experience managers, this unified view is the difference between reacting to symptoms and diagnosing the actual cause of churn or conversion failure. Customer Data Platforms (CDPs), multichannel integration, and behavioral analytics are the core technologies that make this possible.
What is customer journey analytics, and how does it work?
Customer journey analytics is defined as the practice of tracking, measuring, and analyzing all customer interactions over time across every channel a business operates. The industry term most practitioners use is “journey analytics,” and it sits at the intersection of behavioral analytics, data engineering, and CX strategy. Where a traditional dashboard tells you how many users clicked a button, journey analytics tells you which sequence of prior interactions made that click likely, and what happens next.
The process works by collecting event-level data from every touchpoint, resolving those events to a single customer identity, and then sequencing them into a timeline. That timeline becomes the raw material for analysis. Teams can then measure time-to-conversion, identify dropout stages, and model the paths that lead to renewal versus cancellation. The output is not a report. It is a living data asset that updates as customers move through their experience.

The practical implication for CX managers is significant. When you can see the full sequence of interactions before a support ticket or a cancellation, you stop firefighting and start predicting. That shift from reactive to proactive is the core business value of journey analytics.
How does journey analytics differ from journey mapping and traditional analytics?
Customer journey mapping provides the qualitative “what.” It is a visual representation of stages, emotions, and pain points, typically built in a workshop and presented as a static diagram. Journey analytics provides the quantitative “why” by applying real-time data to measure whether the journey you designed is actually working. Both are useful, but they answer different questions.
Traditional web analytics and campaign analytics focus on single touchpoints. A page view report tells you traffic volume. An email open rate tells you subject line performance. Neither tells you whether a customer who opened three emails and visited the pricing page twice is more likely to convert than one who went straight to a demo request. Journey analytics connects those dots across time.
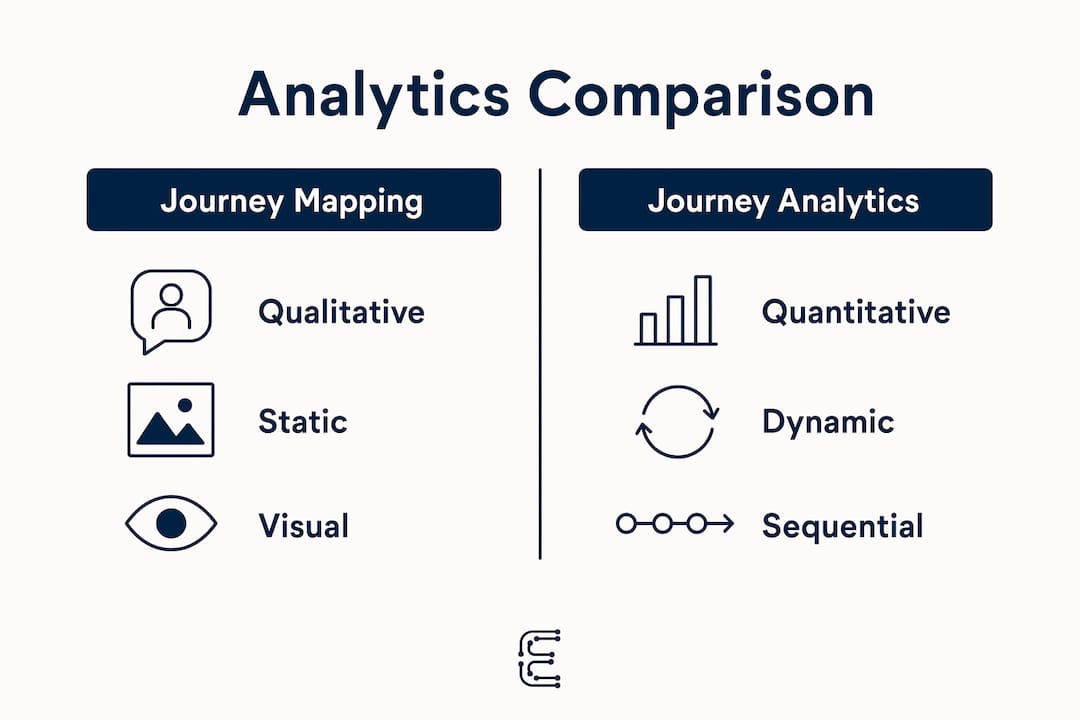
The critical distinction is sequence and continuity. Traditional analytics is a photograph. Journey analytics is a film. The photograph shows you where someone stood at one moment. The film shows you how they got there and where they went next.
Pro Tip: Use journey mapping to build your hypothesis about what the ideal customer path looks like, then use journey analytics to test whether real customers actually follow it. The gap between the two is where your biggest optimization opportunities live.
The table below compares the three approaches across four evaluation criteria.
| Criteria | Journey mapping | Traditional analytics | Journey analytics |
|---|---|---|---|
| Data type | Qualitative | Quantitative | Quantitative |
| View | Static snapshot | Single touchpoint | Cross-channel sequence |
| Update frequency | Periodic | Real-time | Real-time |
| Primary output | Visual diagram | Channel metrics | Behavioral path insights |
What data and technology does effective journey analytics require?
Identity resolution is the technical foundation of any journey analytics program. It is the process of reconciling anonymous and authenticated identifiers, such as cookie IDs, email addresses, device IDs, and CRM records, into a single continuous customer profile. Without it, you have channel metrics. With it, you have a journey.
The data sources that feed journey analytics typically include CRM systems, marketing automation platforms, product telemetry, customer support logs, and digital event streams from web and mobile. Each source uses different identifiers and different data schemas. Stitching them together requires a data integration layer, and this is where Customer Data Platforms (CDPs) play a central role. A CDP ingests, normalizes, and unifies these sources into a persistent customer profile that journey analytics tools can query.
Fragmented data silos are the single biggest barrier to journey analytics. When your email platform does not talk to your product database, and your support system does not connect to your CRM, you cannot build a continuous timeline. You end up with three separate stories about the same customer, none of which is complete. Overcoming data silos requires shifting organizational focus from channel-specific metrics toward metrics aligned with the full customer journey.
Two common pitfalls appear once teams get their data unified. The first is analysis paralysis, which happens when teams try to analyze everything at once and produce no clear findings. The second is misattributing causation to correlation. If customers who attend a webinar convert at higher rates, that does not prove the webinar caused the conversion. It may mean that highly engaged customers self-select into webinars.
Pro Tip: Before building your journey analytics stack, audit which customer identifiers each of your data sources uses. Mapping identifier overlap across systems is the fastest way to assess whether identity resolution is feasible with your current data architecture.
How can teams apply journey analytics to improve engagement and retention?
Journey analytics creates organizational alignment by giving every team, from marketing to product to customer success, a common view of customer interactions. That shared understanding replaces the “leaky bucket” dynamic where each team patches its own hole without knowing what the others are doing. When everyone reads from the same customer timeline, coordination becomes possible.
The most direct application is friction point identification. By sequencing customer events, teams can pinpoint exactly where customers drop out of onboarding, stop using a feature, or disengage before renewal. That dropout stage becomes the target for intervention. A SaaS company might discover that customers who do not complete a specific setup step within the first seven days cancel at three times the rate of those who do. That finding drives a targeted onboarding nudge, not a generic email blast.
Predictive engagement is the next level of application. AI and machine learning enhance journey analytics by enabling behavioral pattern detection and predictive health modeling. When the system identifies that a customer’s usage pattern matches the profile of past churners, it can trigger a proactive outreach before the customer decides to leave. This is the shift from the firefighting loop to a prevention model.
Cross-channel coordination is the third application. Journey analytics reveals which combination of touchpoints drives conversion, not just which individual channel performs best. A customer who receives a targeted email, views a case study, and then joins a live chat session may convert at a significantly higher rate than one who only receives the email. That sequence insight lets marketing teams design coordinated plays rather than isolated campaigns.
The numbered sequence below outlines a practical starting framework for applying journey analytics to retention.
- Define the specific business question you want to answer, such as which interaction sequence predicts trial-to-paid conversion.
- Identify the data sources that capture the relevant touchpoints for that question.
- Resolve customer identities across those sources to build a unified timeline.
- Analyze the sequences that precede the desired outcome versus the sequences that precede dropout.
- Design a targeted intervention at the highest-impact dropout stage.
- Measure the intervention’s effect and iterate based on updated journey data.
What are the common challenges in journey analytics implementation?
The organizational challenges of journey analytics are as significant as the technical ones. Teams often start with the wrong scope, attempting to map and analyze the entire customer lifecycle at once. Starting with specific, high-impact business questions avoids data overload and produces findings that teams can act on quickly. A focused question, such as “what sequence of interactions precedes involuntary churn,” generates a clear investigation path. A broad mandate to “understand the customer journey” generates a six-month project with no clear output.
Lack of clear metrics is the second organizational challenge. Journey analytics produces a large volume of path data, and without predefined success metrics, teams struggle to distinguish signal from noise. The metrics that matter most are those tied directly to business outcomes: conversion rate by journey path, time-to-value by onboarding sequence, and retention rate by engagement pattern.
Journey frameworks standardize and scale journey mapping and analytics programs across teams and regions. A framework defines the stages, the data sources, the metrics, and the governance rules that apply to every journey initiative. Without a framework, each team builds its own version of the customer journey, and the organization ends up with ten different maps that cannot be compared or combined.
Combining quantitative journey data with qualitative insight is a best practice that most teams underinvest in. Correlation in journey analysis must be validated with qualitative methods, such as user interviews or session recordings, to confirm causation. When your data shows that customers who use a specific feature retain at higher rates, a brief user interview can confirm whether the feature is driving retention or whether retained customers simply have more time to explore features. That distinction changes everything about how you prioritize product investment.
Key Takeaways
Customer journey analytics delivers its highest value when identity-resolved, cross-channel data is combined with specific business questions and qualitative validation to drive proactive retention strategies.
| Point | Details |
|---|---|
| Core definition | Journey analytics tracks and sequences every customer interaction across channels into a unified timeline. |
| Identity resolution is foundational | Without resolving customer identifiers across systems, journey analysis remains fragmented channel data. |
| Start narrow, not broad | Define a specific business question first to avoid analysis paralysis and produce findings teams can act on. |
| Validate correlation with qualitative data | User interviews and session recordings confirm whether patterns in journey data reflect causation, not coincidence. |
| Journey frameworks enable scale | Standardized frameworks let organizations reuse templates and govern journey initiatives consistently across teams. |
Why journey analytics is the most underused retention tool in SaaS
Most SaaS teams I work with have more customer data than they know what to do with. They have product telemetry, CRM records, support tickets, and email engagement logs. What they lack is a way to read all of that data as a single, continuous story about each customer. That gap is exactly what journey analytics closes, and it is why I consider it the most underused retention tool available to growth-stage companies today.
The teams that get the most value from journey analytics are not the ones with the most sophisticated technology. They are the ones that start with a sharp business question and resist the temptation to boil the ocean. I have seen companies spend six months building a comprehensive journey map and emerge with a beautiful diagram that no one acts on. I have also seen teams spend three weeks answering one focused question about their trial-to-paid dropout rate and immediately reduce churn in a meaningful way. The discipline of the question matters more than the scale of the analysis.
The future of journey analytics is predictive. AI-powered behavioral pattern detection is moving the practice from descriptive reporting to forecasting. When your analytics system can identify a customer heading toward silent churn before they disengage, you have a window to intervene. That window is where net revenue retention (NRR) is won or lost. The companies that build this capability now will have a structural advantage in customer retention that compounds over time. The ones that wait will keep patching the leaky bucket one hole at a time.
— Raymond
How E-regency helps you turn journey data into retention results
Marketing professionals and CX managers who understand journey analytics still face one persistent challenge: translating data into coordinated action across teams. E-regency’s AI-driven advisory services are built specifically for SaaS founders and growth-stage companies that need to move from fragmented channel metrics to a unified, predictive customer success model.
E-regency combines predictive AI health modeling with hands-on execution support, helping clients align their CX teams around journey-based metrics, integrate data sources, and build retention strategy frameworks that scale. Clients have achieved over a 20% reduction in gross churn and more than 115% increase in net revenue retention. If you are ready to put your journey data to work, schedule a consultation with the E-regency team.
FAQ
What is customer journey analytics in simple terms?
Customer journey analytics is the practice of tracking and analyzing every interaction a customer has with your business across all channels over time. It connects those interactions into a single timeline so you can see the full path from first contact to conversion, renewal, or cancellation.
How does journey analytics differ from customer journey mapping?
Journey mapping is a qualitative, static visualization of customer stages and pain points. Journey analytics is quantitative and dynamic, using real data to measure whether customers actually follow the intended path and where they drop off.
What technology is needed for customer journey analytics?
Effective journey analytics requires a data integration layer, identity resolution capability, and a unified customer data store such as a Customer Data Platform (CDP). These components stitch together CRM, product, support, and digital event data into a single customer timeline.
Why is identity resolution critical for journey analytics?
Without identity resolution, customer interactions across different channels appear as separate, unconnected events. Resolving identifiers into a single profile is what transforms isolated channel data into a continuous, analyzable customer journey.
What is the biggest mistake teams make with journey analytics?
The most common mistake is starting with too broad a scope. Teams that try to analyze the entire customer lifecycle at once produce no clear findings. Starting with one specific business question, such as identifying the sequence that drives trial-to-paid conversion, produces results teams can act on immediately.