

Customer Churn in SaaS: What Leaders Need to Know
TL;DR:
- Customer churn in SaaS measures the percentage of customers who cancel or do not renew their subscriptions over a period. Reducing revenue churn is essential for growth-stage SaaS companies because it directly impacts recurring revenue and valuation. Effective strategies include early onboarding, behavioral monitoring, and separating voluntary from involuntary churn to improve retention and revenue health.
Customer churn in SaaS is defined as the percentage of customers who cancel or stop renewing their subscriptions within a given period. It is the single most direct measure of whether your product retains the revenue relationships it earns. Growth-stage SaaS companies live and die by this number because recurring revenue only compounds when customers stay. Understanding what is customer churn in SaaS, how to measure it accurately, and how to act on it separates companies that scale from those that run the leaky bucket forever.
What is customer churn in SaaS and how does it work?
Customer churn, also called logo churn, is calculated as the number of customers lost during a period divided by the number of customers at the start of that period, multiplied by 100. The result is a percentage that tells you how fast your customer base is eroding. Using the beginning-of-period count as the denominator is the standard practice. It keeps the metric comparable across time and prevents distortions from mid-period new sign-ups.

Customer churn is the most commonly tracked form, but it is not the only one. Revenue churn measures the percentage of monthly recurring revenue (MRR) lost from cancellations and downgrades, not just the count of accounts that left. A SaaS company could lose five small accounts and show a 5% logo churn rate, while a single enterprise downgrade quietly destroys 20% of MRR. That gap is why revenue churn often tells a more urgent story than logo churn alone.
The two metrics serve different purposes. Logo churn tracks customer relationships. Revenue churn tracks financial exposure. Growth-stage leaders need both numbers on their dashboard, not one or the other.
How to calculate gross churn in SaaS
Gross churn rate is calculated at the revenue level using this formula: (MRR lost from cancellations and downgrades ÷ MRR at start of period) × 100. It excludes any expansion revenue from upsells or cross-sells. This makes gross churn a clean measure of pure revenue loss, with no offsetting gains mixed in.
Net churn adds one more layer. Net churn rate equals (MRR lost minus MRR gained from expansions) ÷ MRR at start of period, multiplied by 100. When expansion revenue exceeds lost revenue, net churn turns negative. Negative net churn is the goal for any growth-stage SaaS company because it means existing customers are growing faster than they are leaving.
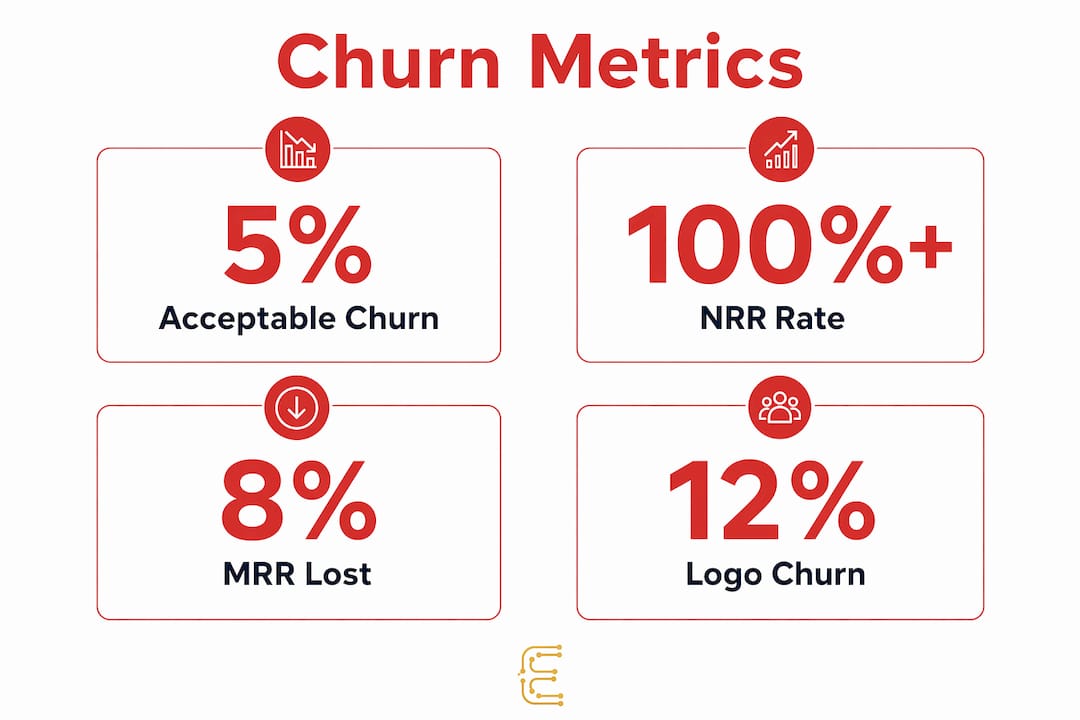
A practical example clarifies the difference. Suppose you start the month with $100,000 MRR. You lose $8,000 from cancellations and downgrades. You gain $5,000 from upsells. Gross churn is 8%. Net churn is 3%. The gross figure shows the real damage. The net figure shows whether expansion is covering the wound.
Pro Tip: Never use end-of-period customer count as your denominator. Misaligned churn definitions cause teams to misattribute causes and timing, leading to interventions that fix the wrong problem at the wrong moment.
| Metric | Formula | What it reveals |
|---|---|---|
| Logo churn rate | (Customers lost ÷ Customers at start) × 100 | Rate of customer relationship loss |
| Gross revenue churn | (MRR lost ÷ MRR at start) × 100 | Pure financial damage from cancellations |
| Net revenue churn | (MRR lost minus MRR gained) ÷ MRR at start × 100 | Net revenue impact after expansions |
What are GRR and NRR, and why do they matter?
Gross Revenue Retention (GRR) and Net Revenue Retention (NRR) are the two retention metrics that SaaS investors and boards watch most closely. GRR measures retained recurring revenue excluding any expansion revenue. NRR includes upsells, cross-sells, and seat expansions. GRR is always equal to or lower than NRR because it strips out the upside.
NRR can exceed 100%. When it does, it means your existing customer base is generating more revenue this period than it did last period, even after accounting for all losses. That is the clearest signal of product-market fit and customer health in a single number. A company with 115% NRR is growing from its existing base without acquiring a single new customer.
GRR is the more conservative and often more honest metric. It shows what you actually keep when expansion is removed from the picture. A company with 90% NRR but only 70% GRR is masking serious churn with aggressive upselling. Both numbers must be tracked together to avoid being misled by expansion revenue covering underlying losses.
Pro Tip: If your NRR looks healthy but your GRR is declining, you have a churn problem that upsells are temporarily hiding. Monitor both metrics side by side every month, not just at board reporting time.
Why does early churn happen in SaaS?
Common churn drivers in SaaS include poor product fit, pricing and value mismatches, weak onboarding, inadequate support, and customer disengagement. Each driver operates differently, but they share a common thread: the customer never reached the moment where the product felt indispensable. That moment is sometimes called the “aha moment,” and failing to reach it early is the most predictable path to early churn.
Involuntary churn is a separate and often underestimated category. It happens when customers want to stay but a payment failure ends their subscription. Failed credit card charges, expired cards, and billing errors all create involuntary churn that has nothing to do with product satisfaction. Separating voluntary from involuntary churn is the first step to addressing each with the right intervention.
Behavioral signals appear before customers cancel. Declining login frequency, reduced feature adoption, and shrinking session length are all forms of “silent churn,” where a customer has mentally left before they formally cancel. Customer telemetry, meaning the data trail left by product usage, is the earliest warning system available to a growth-stage team. Tracking these signals weekly, not monthly, gives customer success managers time to intervene before the cancellation request arrives.
Pro Tip: Build a simple health score using three signals: login frequency, core feature usage, and support ticket volume. Customers who score low on all three are in the pre-churn zone and need direct outreach within 48 hours.
What churn rate is acceptable for a SaaS company?
Annual SaaS churn benchmarks range widely, with overall averages running between 10% and 14% per year. A rate below 5% annually is considered a strong benchmark. Enterprise SaaS companies typically target monthly churn closer to 1–2%, while SMB-focused products accept higher rates due to smaller contract sizes and faster customer turnover.
These benchmarks only mean something when the metric definitions match. A company counting churn at cancellation and a company counting churn at renewal expiration will produce different numbers for the same underlying business. Before comparing your churn rate to any industry figure, confirm that your measurement convention matches the source.
Churn also directly affects SaaS valuation. High churn compresses revenue multiples because investors discount future cash flows when retention is uncertain. Reducing monthly churn from 5% to 3% can increase customer lifetime value by approximately 67%. That improvement flows directly into unit economics, growth forecasts, and ultimately the price a company commands in a fundraise or acquisition.
| Customer segment | Acceptable annual churn | Monthly equivalent |
|---|---|---|
| Enterprise SaaS | 5% or below | ~1–2% |
| Mid-market SaaS | 5–10% | ~0.5–1% |
| SMB SaaS | 10–14% | ~1–2% |
How to reduce customer churn in SaaS
Onboarding is the highest-leverage intervention for reducing early churn. Customers who reach early value milestones churn at substantially lower rates than those who do not complete onboarding. A structured onboarding program with defined checkpoints, time-to-value targets, and proactive check-ins converts new sign-ups into committed users before the first renewal arrives.
Behavioral analytics turn reactive support into proactive retention. When a customer’s usage drops below a defined threshold, an automated alert triggers a customer success outreach. This shifts the team from a firefighting loop, where they respond to cancellation requests, to a prevention model, where they address disengagement before it becomes a decision to leave.
Involuntary churn requires its own operational track. Automated dunning sequences, card update reminders, and payment retry logic recover revenue that would otherwise disappear silently. This is not a customer success problem. It is a revenue reliability project, and it deserves dedicated ownership separate from voluntary churn reduction efforts.
Pro Tip: Segment your retention efforts by cohort. Cohort-based churn analysis reveals whether a specific acquisition channel, pricing tier, or onboarding path is producing disproportionate churn. Fixing one bad cohort can move your overall rate more than a company-wide initiative.
Key Takeaways
Customer churn in SaaS is a revenue problem first and a customer count problem second. Measuring and managing it at the revenue level, with clear separation between voluntary and involuntary causes, is the foundation of a durable retention strategy.
| Point | Details |
|---|---|
| Use revenue churn, not just logo churn | Revenue churn reveals financial exposure that customer count alone cannot show. |
| Track GRR and NRR together | GRR shows pure retention; NRR shows net growth. Expansion can mask underlying churn. |
| Benchmark with matching definitions | Annual SaaS churn averages 10–14%; below 5% is strong, but only when definitions align. |
| Act on behavioral signals early | Declining usage and login frequency predict cancellation before the customer requests it. |
| Separate voluntary from involuntary churn | Each type requires a different intervention. Mixing them produces the wrong fix for the wrong problem. |
Why revenue churn deserves more attention than most teams give it
Most growth-stage SaaS teams I work with track logo churn religiously and treat revenue churn as a secondary report. That order of priority is backward. Logo churn tells you how many relationships you lost. Revenue churn tells you how much of your business you lost. Those are very different questions, and the second one is the one your investors are asking.
The deeper problem is that stable logo churn can coexist with deteriorating revenue health. If your largest accounts are quietly downgrading while smaller accounts stay put, your customer count barely moves. But your MRR takes a serious hit. Revenue concentration risk is the hidden vulnerability that logo churn metrics simply cannot surface.
The teams that manage churn well do three things consistently. They weight their churn analysis by revenue, not headcount. They run cohort analysis monthly to catch deteriorating segments before they compound. And they treat involuntary churn as a separate operational problem with its own recovery metrics. The companies that do all three rarely find themselves surprised by a bad quarter.
The last thing I would add is this: churn analysis is only as good as the definitions behind it. I have seen growth-stage teams spend months debating their retention numbers, only to discover they were measuring cancellation date in one system and renewal expiration in another. Synchronizing churn and revenue recognition conventions across your CRM, billing platform, and finance team is not glamorous work. It is the work that makes every other retention effort actually measurable.
— Raymond
How E-regency helps SaaS leaders take control of churn
Churn is not just a metric to monitor. It is a signal that your customer success model needs a structural response.
E-regency works with growth-stage SaaS founders and customer success leaders to build the retention frameworks that move these numbers. Clients have seen over a 20% reduction in gross churn and more than 115% increase in net revenue retention by combining predictive AI health modeling with hands-on execution. If your team is ready to shift from reactive support to a model that generates revenue from existing customers, explore E-regency’s advisory services or schedule a personalized session to map out a retention strategy built for your specific stage and segment.
FAQ
What is customer churn rate in SaaS?
Customer churn rate in SaaS is the percentage of customers who cancel or stop renewing during a defined period, calculated as customers lost divided by customers at the start of the period, multiplied by 100.
What is the difference between gross churn and net churn?
Gross churn measures only revenue lost from cancellations and downgrades. Net churn subtracts expansion revenue from that loss, and it can turn negative when upsells outpace cancellations.
What is a good SaaS churn rate?
An annual churn rate below 5% is considered a strong benchmark for most SaaS companies. Enterprise-focused products typically target monthly churn of 1–2%, while SMB products often run higher.
Why does churn hurt SaaS valuation?
High churn compresses revenue multiples because investors discount future cash flows when retention is uncertain. Reducing monthly churn from 5% to 3% can increase customer lifetime value by approximately 67%.
What causes early churn in SaaS?
Early churn most often results from weak onboarding, poor product fit, and failure to reach early value milestones. Customers who do not complete onboarding churn at substantially higher rates than those who do.